
Coverage:
United Kingdom
Released:
23 May 2017
Next release:
21 June 2017
Frequency of release:
Monthly
Media contact:
HMRC Press Office
03000 585 024
Statistical contacts:
Laura Trewick
03000 510 550
revenuemonitoring@hmrc.gsi.gov.uk
Mark Dickson
03000 515 305
revenuemonitoring@hmrc.gsi.gov.uk
KAI Indirect Taxes, Customs & Coordination
HM Revenue and Customs
100 Parliament Street
London
SW1A 2BQ
Website: UK Property Transaction Statistics
https://www.gov.uk/government/collections/property-transactions-in-the-uk
UK Property
Transaction
Statistics

April 2017
Section 1: Statistics
Note: This page is experimental work to develop interactive visualisations of the statistics published here, where you can find more up-to-date data. This page is not itself a statistical release.Guidance on the statistics
This publication presents monthly estimates of the number of residential and non-residential property transactions in the UK and its constituent countries. The figures are based on HMRC’s Stamp Duty Land Tax (SDLT) and the Scottish Administration’s Land and Buildings Transactions Tax (LBTT) databases. LBTT data was introduced from April 2015 so the figures from this date should be treated with particular caution. More information about data sources, quality and methodology can be found on page 7.
These statistics are generally used by analysts, academics and policy makers to examine movements and trends in the UK property market. They are best used in conjunction with other housing market indicators, for example HMRC’s Quarterly Stamp Duty Statistics Bulletin. Note that the statistics in the Quarterly Stamp Duty Statistics Bulletin are based on the SDLT certification date, whereas this bulletin reports transactions on the basis of completion date. As these dates can be up to 30 days apart, the number of transactions will differ between the two publications. Links to related statistics can be found in the ‘Related Statistics’ section on page 7.
[Reviewed 23 May 2017 / Next Review 21 June 2017]
Current Financial Year
Commentary and Charts
Key messages
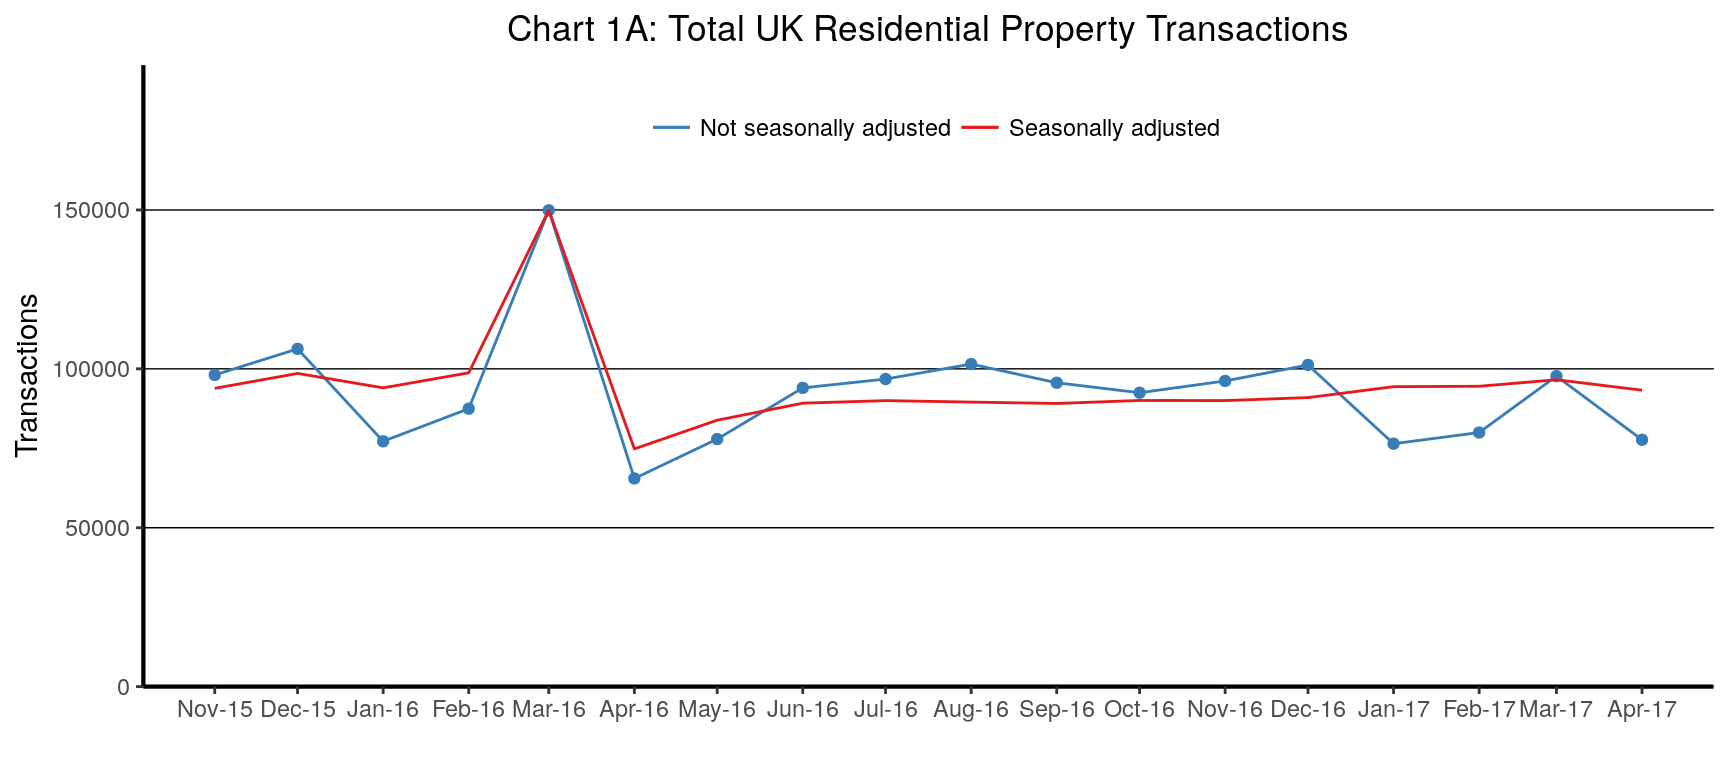
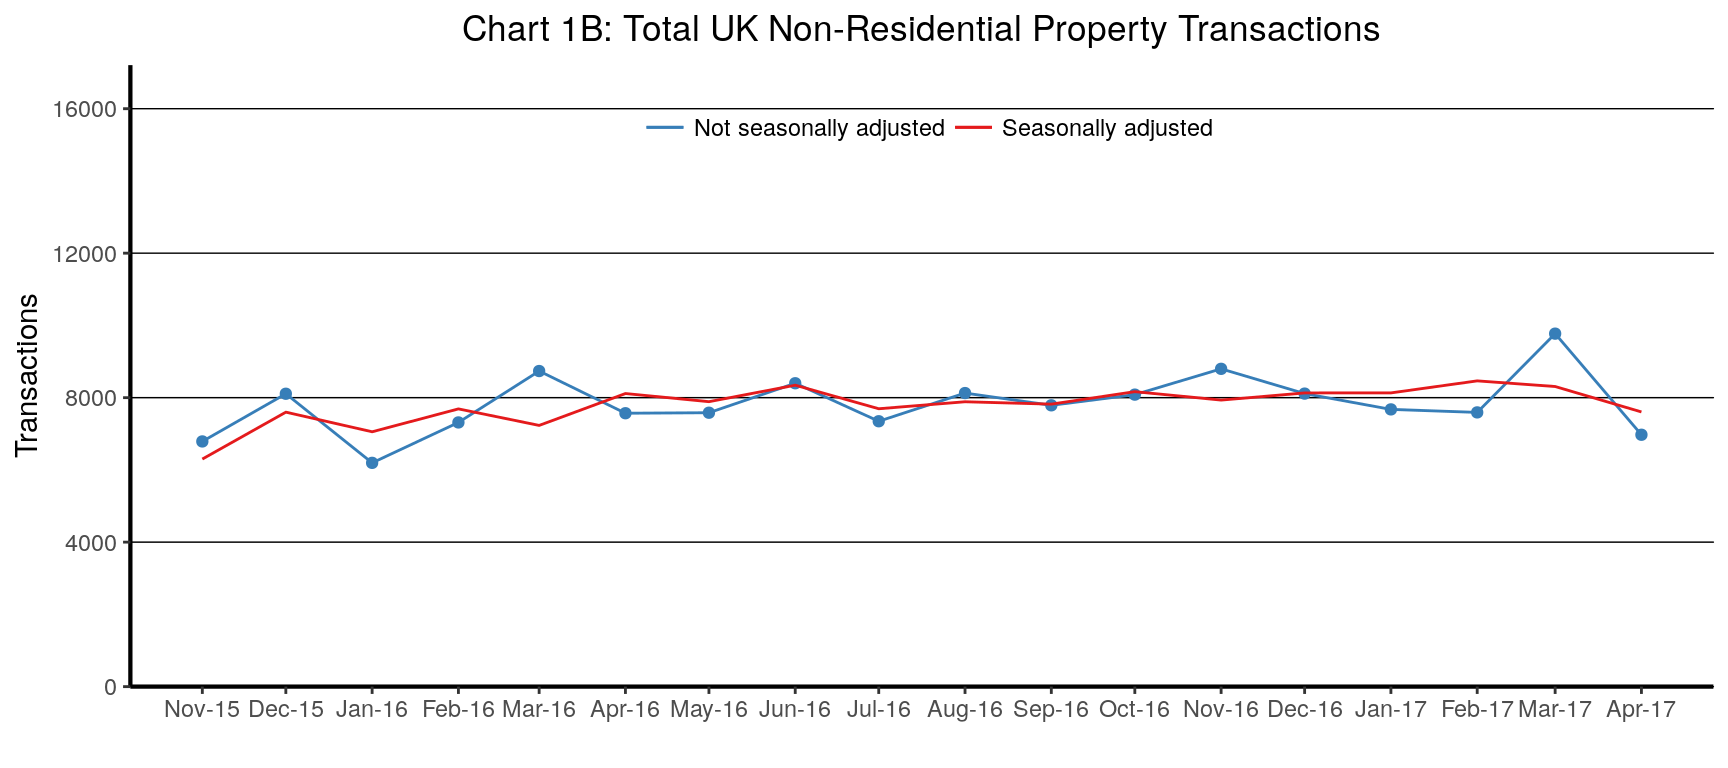
The provisional seasonally adjusted UK property transaction count for April 2017 was 93,280 residential and 7,600 non-residential transactions.
Residential transactions
The seasonally adjusted estimate of the number of residential property transactions decreased by 3.4% between March 2017 and April 2017. This month’s seasonally adjusted figure is 24.7% higher compared with the same month last year, and has increased by 24.7% compared with transactions in April 2015. Chart 1A shows the historic time series for residential property transactions.
Caution should be used making comparisons of transactions between April 2017 and April 2016 as some taxpayers may have changed their behaviour as they considered the result of the June 2017 General Election, and the EU referendum in June 2016.
For April 2017 the number of non-adjusted residential transactions was about and has decreased by 20.5% than in March 2017. The number of non-adjusted residential transactions was 18.6% higher compared with April 2016.
The figures for the three most recent months are provisional and therefore subject to revision.
[Reviewed 23 May 2017 / Next Review 21 June 2017]
Non-residential transactions
The seasonally adjusted estimate of the number of non-residential property transactions decreased by 8.5% between March 2017 and April 2017. This month’s figure is 6.3% lower compared with the same month last year. Chart 1B shows the historic time series for non-residential property transactions
Non adjusted transactions have seen monthly peaks and falls as can be expected due to the seasonal nature of purchases.
Budget 2016 included a major reform to non-residential SDLT, moving from a ‘slab’ to a marginal rate ‘slice’ system. This was effective as of midnight 16 March 2016 and therefore that month includes transactions under both regimes.
The figures for the three most recent months are provisional and therefore subject to revision.
[Reviewed 23 May 2017 / Next Review 21 June 2017]
Residential property transaction completions (and Revisions)
Annual and Monthly Tables
| Number of residential property transaction completions with value £40,000 or above1 2 3 | |||||||
| Not seasonally adjusted* | Seasonally adjusted* | ||||||
|---|---|---|---|---|---|---|---|
| England | Scotland | Wales | Northern Ireland | UK | UK | ||
| Annual (financial year) | |||||||
| 2012-13 | 756,260 | 73,740 | 37,100 | 14,960 | 882,060 | 881,220 | |
| 2013-14 | 980,250 | 89,140 | 47,110 | 20,220 | 1,136,730 | 1,141,960 | |
| 2014-15 | 1,021,920 | 94,620 | 49,290 | 23,060 | 1,188,900 | 1,186,130 | |
| 2015-16 | 1,050,050 | 96,440 | 50,450 | 23,390 | 1,220,340 | 1,211,280 | |
| 2016-17 | 920,600 | 84,630 | 48,090 | 22,010 | 1,075,330 | 1,073,010 | |
| Annual (calendar year) | |||||||
| 2012 | 735,480 | 73,840 | 35,980 | 14,260 | 859,560 | 856,550 | |
| 2013 | 931,520 | 85,510 | 45,140 | 18,980 | 1,081,150 | 1,074,260 | |
| 2014 | 1,049,410 | 94,410 | 50,260 | 23,340 | 1,217,410 | 1,219,400 | |
| 2015 | 979,010 | 94,120 | 47,340 | 22,180 | 1,142,640 | 1,141,340 | |
| 2016 | 976,400 | 87,580 | 49,080 | 22,710 | 1,135,770 | 1,130,230 | |
| Monthly | |||||||
| Nov-15 | 83,720 | 8,210 | 4,210 | 1,950 | 98,080 | 93,870 | |
| Dec-15 | 91,850 | 7,850 | 4,570 | 2,010 | 106,290 | 98,550 | |
| Jan-16 | 66,780 | 5,960 | 2,990 | 1,460 | 77,200 | 94,020 | |
| Feb-16 | 76,840 | 5,310 | 3,660 | 1,650 | 87,460 | 98,750 | |
| Mar-16 | 130,600 | 10,270 | 6,120 | 2,890 | 149,880 | 149,930 | |
| Apr-16 | 55,530 | 5,820 | 2,860 | 1,300 | 65,510 | 74,820 | |
| May-16 | 66,660 | 6,270 | 3,400 | 1,560 | 77,900 | 83,850 | |
| Jun-16 | 80,410 | 7,680 | 3,990 | 1,930 | 94,010 | 89,200 | |
| Jul-16 | 82,970 | 7,830 | 4,170 | 1,820 | 96,800 | 90,000 | |
| Aug-16 | 87,360 | 7,720 | 4,430 | 1,990 | 101,500 | 89,540 | |
| Sep-16 | 81,530 | 7,880 | 4,170 | 2,030 | 95,620 | 89,110 | |
| Oct-16 | 79,310 | 7,120 | 4,190 | 1,870 | 92,480 | 90,050 | |
| Nov-16 | 82,040 | 7,740 | 4,350 | 2,070 | 96,190 | 90,010 | |
| Dec-16 | 86,370 | 7,970 | 4,740 | 2,150 | 101,230 | 90,960 | |
| Jan-17 | 65,880 | 5,620 | 3,300 | 1,640 | 76,440 | 94,380 | |
| Feb-17 | 69,550 | 5,220 | 3,510 | 1,680 | 79,960 | 94,520 | |
| Mar-17 | 82,980 | 7,760 | 4,970 | 1,990 | 97,700 | 96,570 | |
R Revised to reflect substantial amendments to tax returns data at the UK level, or changes in our seasonal adjustment methodology.
P Provisional.
1 Property transactions are allocated to the month in which the transaction was completed.
2 Not all completed transactions in the month prior to processing or the month before that will have been processed when figures for the latest month are compiled. Estimates are therefore made for the missing transactions in both the latest month and the previous month.
Month on month changes for the most recent data should not be given too much weight.
3 From April 2015 Stamp Duty Land Tax was replaced by Land and Buildings Transaction Tax in Scotland and HMRC stopped collecting data on Scotland’s transactions. HMRC are using LBTT data from Revenue Scotland to continue the series. However, there might be some discontinuities for the Scottish component of the series after April 2015. We will provide more information in future publications. Over the longer term we will review whether the series combining data in this manner meets users’ requirements
* See Reference Notes on Sheet 7
Non-residential property transaction completions (and Revisions)
Annual and Monthly Tables
| Number of non-residential property transaction completions with value £40,000 or above1 2 3 | |||||||
| Not seasonally adjusted* | Seasonally adjusted* | ||||||
|---|---|---|---|---|---|---|---|
| England | Scotland | Wales | Northern Ireland | UK | UK | ||
| Annual (financial year) | |||||||
| 2012-13 | 61,930 | 8,030 | 3,050 | 1,610 | 74,620 | 74,310 | |
| 2013-14 | 73,470 | 8,760 | 3,710 | 2,080 | 88,010 | 88,050 | |
| 2014-15 | 76,640 | 9,600 | 3,960 | 2,280 | 92,480 | 92,360 | |
| 2015-16 | 76,990 | 6,180 | 3,980 | 2,510 | 89,670 | 89,220 | |
| 2016-17 | 83,710 | 5,870 | 4,440 | 2,820 | 96,850 | 96,880 | |
| Annual (calendar year) | |||||||
| 2012 | 58,630 | 8,030 | 2,900 | 1,510 | 71,080 | 70,870 | |
| 2013 | 72,070 | 8,510 | 3,580 | 2,000 | 86,160 | 85,780 | |
| 2014 | 77,400 | 9,490 | 3,960 | 2,290 | 93,140 | 92,950 | |
| 2015 | 75,540 | 7,010 | 3,970 | 2,440 | 88,960 | 89,220 | |
| 2016 | 81,150 | 5,860 | 4,310 | 2,740 | 94,050 | 93,950 | |
| Monthly | |||||||
| Nov-15 | 5,800 | 540 | 280 | 170 | 6,790 | 6,300 | |
| Dec-15 | 6,860 | 650 | 350 | 260 | 8,110 | 7,600 | |
| Jan-16 | 5,380 | 410 | 240 | 160 | 6,200 | 7,060 | |
| Feb-16 | 6,410 | 420 | 290 | 200 | 7,310 | 7,690 | |
| Mar-16 | 7,430 | 660 | 410 | 230 | 8,740 | 7,230 | |
| Apr-16 | 6,490 | 490 | 350 | 240 | 7,570 | 8,110 | |
| May-16 | 6,510 | 460 | 340 | 270 | 7,580 | 7,890 | |
| Jun-16 | 7,270 | 500 | 390 | 230 | 8,400 | 8,350 | |
| Jul-16 | 6,390 | 430 | 350 | 180 | 7,350 | 7,690 | |
| Aug-16 | 6,990 | 440 | 450 | 240 | 8,130 | 7,890 | |
| Sep-16 | 6,770 | 450 | 380 | 190 | 7,790 | 7,820 | |
| Oct-16 | 7,040 | 430 | 350 | 260 | 8,080 | 8,170 | |
| Nov-16 | 7,560 | 550 | 390 | 300 | 8,800 | 7,930 | |
| Dec-16 | 6,910 | 610 | 350 | 230 | 8,110 | 8,130 | |
| Jan-17 | 6,760 | 400 | 300 | 210 | 7,680 | 8,130 | |
| Feb-17 | 6,600 | 440 | 340 | 220 | 7,590 | 8,460 | |
| Mar-17 | 8,420 | 670 | 440 | 240 | 9,770 | 8,310 | |
R Revised to reflect substantial amendments to tax returns data at the UK level, or changes in our seasonal adjustment methodology.
P Provisional.
1 Property transactions are allocated to the month in which the transaction was completed.
2 Not all completed transactions in the month prior to processing or the month before that will have been processed when figures for the latest month are compiled. Estimates are therefore made for the missing transactions in both the latest month and the previous month.
Month on month changes for the most recent data should not be given too much weight.
3 From April 2015 Stamp Duty Land Tax was replaced by Land and Buildings Transaction Tax in Scotland and HMRC stopped collecting data on Scotland’s transactions. HMRC are using LBTT data from Revenue Scotland to continue the series. However, there might be some discontinuities for the Scottish component of the series after April 2015. We will provide more information in future publications. Over the longer term we will review whether the series combining data in this manner meets users’ requirements
* See Reference Notes on Sheet 7
Historic
Historic Trends: Commentary and Charts
Residential transactions
The long term movement in the number of residential property transactions shown in Chart 4A reflects the general performance of the housing market over the past twelve years. The clearest feature of the time series is the sharp fall in residential transactions at the end of 2007, coinciding with the housing market slump and credit crunch. Prior to this point, the number of transactions had risen constantly over a number of years to reach a peak of around 150,000 per month. From December 2008 to February 2014, there was a slow but steady upward trend in the seasonally adjusted count.
The seasonally adjusted transaction estimate shows a distinct peak at December 2009. This is associated with the end of the Stamp Duty Land Tax ‘holiday’, during which the lower tax threshold was temporarily raised to £175,000. The forestalling effects of this ‘holiday’ coming to an end also show as higher than normal transactions in the previous few months as homebuyers brought forward their purchases. There is a corresponding drop in the early months of 2010.
There is another, smaller, peak and trough in March and April 2012 due to the ending of the SDLT first time buyers’ relief. This relief was in effect from 25 March 2010 to 24 March 2012 inclusive. Around 7,000 transactions per month benefitted from this relief, although this number doubled in its final month.
March 2016 recorded the highest number of transactions in the last ten years. This peak is associated with the introduction of higher rates on additional properties in April 2016.
Comparison of the not-seasonally adjusted and seasonally adjusted data in Chart 4A shows that activity in the residential housing market is strongest in the summer months with a clear low point around the end of the calendar year.
[Reviewed 23 May 2017 / Next Review 21 June 2017]
Non-residential transactions
The non-residential property market has mirrored, to a large extent, the ups and downs of the residential market. The credit crunch effects from 2007 triggered a similar fall in transactions but not to quite the same extent as in the residential market.
The trend in non-residential property transactions has been that of a generally flat seasonal cycle between September 2010 and September 2013, but since then there has been a rising trend. Unlike the residential market, there have been no temporary tax reliefs or ‘holidays’ in recent years to distort the underlying trend.
The seasonal pattern of the non-residential series is much less pronounced than that of the residential market, although there tends to be a low point at the start of the calendar year, with a corresponding peak each March coinciding with the end of the financial year.
[Reviewed 23 May 2017 / Next Review 21 June 2017]
Residential and non-residential transactions for the UK constituent countries
The following tables are produced from the historical data on pages 5 and 6 and show the individual breakdowns of residential and non-residential property transactions for each of the United Kingdom’s four constituent countries.
Unlike the UK aggregate series, these country breakdowns are not seasonally adjusted. However, they do exhibit similar seasonal patterns and care should be taken when examining month to month movements.
As the volume of residential and non-residential property transactions varies greatly, the transactions are displayed on a dual axis chart (residential on the left axis and non-residential on the right).
[Reviewed 23 May 2017 / Next Review 21 June 2017]
Residential property transaction completions (Historic Table)
Annual, Quarterly and Monthly Tables
| Number of residential property transaction completions with value £40,000 or above1 2 3 | |||||||
| Not seasonally adjusted* | Seasonally adjusted* | ||||||
|---|---|---|---|---|---|---|---|
| England | Scotland | Wales | Northern Ireland | UK | UK | ||
| Annual (financial year) | |||||||
| 2005-06 | 1,209,080 | 131,240 | 59,860 | 43,910 | 1,444,080 | 1,444,090 | |
| 2006-07 | 1,433,200 | 146,240 | 72,280 | 50,970 | 1,702,690 | 1,710,160 | |
| 2007-08 | 1,256,540 | 143,330 | 63,050 | 29,890 | 1,492,820 | 1,473,930 | |
| 2008-09 | 629,880 | 83,990 | 33,200 | 12,110 | 759,190 | 792,880 | |
| 2009-10 | 695,070 | 73,510 | 33,870 | 13,770 | 816,220 | 892,930 | |
| 2010-11 | 700,480 | 72,140 | 34,530 | 13,150 | 820,310 | 819,500 | |
| 2011-12 | 702,020 | 73,100 | 34,470 | 13,000 | 822,580 | 819,660 | |
| 2012-13 | 756,260 | 73,740 | 37,100 | 14,960 | 882,060 | 881,220 | |
| 2013-14 | 980,250 | 89,140 | 47,110 | 20,220 | 1,136,730 | 1,141,960 | |
| 2014-15 | 1,021,920 | 94,620 | 49,290 | 23,060 | 1,188,900 | 1,186,130 | |
| 2015-16 | 1,050,050 | 96,440 | 50,450 | 23,390 | 1,220,340 | 1,211,280 | |
| 2016-17 | 920,600 | 84,630 | 48,090 | 22,010 | 1,075,330 | 1,073,010 | |
| Annual (calendar year) | |||||||
| 2006 | 1,404,710 | 144,400 | 71,010 | 50,310 | 1,670,420 | 1,668,460 | |
| 2007 | 1,361,520 | 147,200 | 68,080 | 37,010 | 1,613,820 | 1,618,870 | |
| 2008 | 729,140 | 96,360 | 37,670 | 13,650 | 876,820 | 916,920 | |
| 2009 | 662,160 | 71,850 | 32,860 | 13,310 | 780,170 | 847,540 | |
| 2010 | 699,510 | 73,110 | 34,250 | 13,220 | 820,100 | 841,760 | |
| 2011 | 682,620 | 70,750 | 33,920 | 12,570 | 799,860 | 799,950 | |
| 2012 | 735,480 | 73,840 | 35,980 | 14,260 | 859,560 | 856,550 | |
| 2013 | 931,520 | 85,510 | 45,140 | 18,980 | 1,081,150 | 1,074,260 | |
| 2014 | 1,049,410 | 94,410 | 50,260 | 23,340 | 1,217,410 | 1,219,400 | |
| 2015 | 979,010 | 94,120 | 47,340 | 22,180 | 1,142,640 | 1,141,340 | |
| 2016 | 976,400 | 87,580 | 49,080 | 22,710 | 1,135,770 | 1,130,230 | |
| Quarterly (calendar year) | |||||||
| 2005-Q2 | 283,570 | 32,840 | 14,100 | 10,340 | 340,850 | 332,410 | |
| 2005-Q3 | 322,520 | 37,040 | 15,720 | 11,580 | 386,860 | 346,670 | |
| 2005-Q4 | 319,380 | 34,530 | 16,120 | 11,680 | 381,700 | 366,900 | |
| 2006-Q1 | 283,610 | 26,830 | 13,910 | 10,310 | 334,660 | 398,120 | |
| 2006-Q2 | 350,020 | 38,360 | 17,730 | 13,170 | 419,280 | 405,650 | |
| 2006-Q3 | 384,790 | 40,140 | 19,090 | 13,110 | 457,130 | 425,090 | |
| 2006-Q4 | 386,280 | 39,070 | 20,280 | 13,720 | 459,350 | 439,610 | |
| 2007-Q1 | 312,110 | 28,670 | 15,190 | 10,970 | 366,930 | 439,810 | |
| 2007-Q2 | 357,710 | 40,810 | 17,990 | 11,730 | 428,240 | 416,430 | |
| 2007-Q3 | 374,700 | 41,030 | 18,520 | 8,690 | 442,940 | 408,270 | |
| 2007-Q4 | 317,000 | 36,690 | 16,380 | 5,620 | 375,700 | 354,360 | |
| 2008-Q1 | 207,130 | 24,800 | 10,160 | 3,840 | 245,930 | 294,880 | |
| 2008-Q2 | 216,750 | 30,110 | 11,560 | 4,280 | 262,700 | 259,330 | |
| 2008-Q3 | 171,300 | 22,500 | 8,700 | 2,960 | 205,460 | 187,810 | |
| 2008-Q4 | 133,970 | 18,950 | 7,250 | 2,570 | 162,730 | 174,900 | |
| 2009-Q1 | 107,870 | 12,440 | 5,690 | 2,310 | 128,310 | 170,840 | |
| 2009-Q2 | 148,530 | 17,530 | 7,730 | 3,180 | 176,970 | 193,270 | |
| 2009-Q3 | 189,150 | 20,110 | 9,080 | 3,670 | 222,010 | 223,690 | |
| 2009-Q4 | 216,600 | 21,770 | 10,360 | 4,150 | 252,890 | 259,750 | |
| 2010-Q1 | 140,780 | 14,090 | 6,700 | 2,770 | 164,350 | 216,230 | |
| 2010-Q2 | 177,650 | 19,480 | 9,020 | 3,470 | 209,620 | 213,610 | |
| 2010-Q3 | 198,840 | 20,630 | 9,270 | 3,660 | 232,410 | 217,290 | |
| 2010-Q4 | 182,240 | 18,910 | 9,250 | 3,320 | 213,720 | 194,630 | |
| 2011-Q1 | 141,760 | 13,130 | 6,980 | 2,700 | 164,560 | 193,970 | |
| 2011-Q2 | 165,240 | 18,130 | 8,220 | 3,040 | 194,630 | 198,090 | |
| 2011-Q3 | 182,600 | 20,820 | 8,860 | 3,220 | 215,500 | 196,870 | |
| 2011-Q4 | 193,020 | 18,680 | 9,860 | 3,610 | 225,160 | 211,020 | |
| 2012-Q1 | 161,150 | 15,470 | 7,530 | 3,130 | 187,280 | 213,670 | |
| 2012-Q2 | 170,760 | 19,320 | 8,650 | 3,200 | 201,940 | 204,820 | |
| 2012-Q3 | 193,170 | 19,440 | 9,160 | 3,670 | 225,440 | 212,410 | |
| 2012-Q4 | 210,390 | 19,610 | 10,640 | 4,260 | 244,900 | 225,650 | |
| 2013-Q1 | 181,930 | 15,370 | 8,650 | 3,830 | 209,790 | 238,340 | |
| 2013-Q2 | 216,610 | 21,840 | 10,720 | 4,250 | 253,420 | 262,820 | |
| 2013-Q3 | 259,400 | 23,870 | 12,350 | 5,180 | 300,800 | 279,400 | |
| 2013-Q4 | 273,580 | 24,420 | 13,420 | 5,720 | 317,140 | 293,690 | |
| 2014-Q1 | 230,670 | 19,010 | 10,620 | 5,070 | 265,370 | 306,040 | |
| 2014-Q2 | 264,360 | 25,380 | 12,840 | 5,820 | 308,400 | 316,120 | |
| 2014-Q3 | 280,730 | 25,520 | 13,310 | 5,970 | 325,530 | 303,630 | |
| 2014-Q4 | 273,660 | 24,500 | 13,490 | 6,480 | 318,120 | 293,610 | |
| 2015-Q1 | 203,180 | 19,220 | 9,660 | 4,790 | 236,850 | 272,760 | |
| 2015-Q2 | 235,070 | 24,010 | 11,370 | 5,280 | 275,730 | 282,450 | |
| 2015-Q3 | 271,770 | 25,770 | 12,860 | 5,950 | 316,360 | 295,010 | |
| 2015-Q4 | 268,980 | 25,120 | 13,440 | 6,150 | 313,700 | 291,120 | |
| 2016-Q1 | 274,220 | 21,540 | 12,770 | 6,000 | 314,540 | 342,700 | |
| 2016-Q2 | 202,600 | 19,780 | 10,250 | 4,790 | 237,420 | 247,870 | |
| 2016-Q3 | 251,870 | 23,440 | 12,770 | 5,840 | 293,920 | 268,640 | |
| 2016-Q4 | 247,710 | 22,820 | 13,280 | 6,080 | 289,900 | 271,020 | |
| 2017-Q1 | 218,420 | 18,600 | 11,790 | 5,300 | 254,100 | 285,480 | |
| Monthly | |||||||
| Apr-05 | 88,840 | 10,540 | 4,520 | 3,290 | 107,180 | 109,680 | |
| May-05 | 91,030 | 10,180 | 4,540 | 3,260 | 109,010 | 110,270 | |
| Jun-05 | 103,700 | 12,120 | 5,050 | 3,790 | 124,660 | 112,460 | |
| Jul-05 | 107,770 | 12,530 | 5,160 | 3,700 | 129,160 | 113,610 | |
| Aug-05 | 107,040 | 12,000 | 5,200 | 3,910 | 128,140 | 115,470 | |
| Sep-05 | 107,710 | 12,510 | 5,370 | 3,970 | 129,560 | 117,590 | |
| Oct-05 | 100,650 | 11,410 | 5,080 | 3,710 | 120,860 | 120,990 | |
| Nov-05 | 103,570 | 11,690 | 5,290 | 3,990 | 124,540 | 119,270 | |
| Dec-05 | 115,150 | 11,430 | 5,750 | 3,970 | 136,300 | 126,640 | |
| Jan-06 | 83,980 | 8,500 | 3,970 | 3,280 | 99,730 | 132,100 | |
| Feb-06 | 87,550 | 7,150 | 4,310 | 3,220 | 102,230 | 133,940 | |
| Mar-06 | 112,090 | 11,180 | 5,630 | 3,810 | 132,700 | 132,080 | |
| Apr-06 | 101,830 | 10,690 | 5,080 | 3,670 | 121,280 | 135,880 | |
| May-06 | 113,160 | 11,990 | 5,680 | 4,200 | 135,030 | 133,370 | |
| Jun-06 | 135,030 | 15,670 | 6,970 | 5,300 | 162,980 | 136,400 | |
| Jul-06 | 125,720 | 12,790 | 6,090 | 3,880 | 148,490 | 140,770 | |
| Aug-06 | 132,180 | 13,430 | 6,440 | 4,510 | 156,550 | 142,280 | |
| Sep-06 | 126,890 | 13,930 | 6,560 | 4,720 | 152,090 | 142,030 | |
| Oct-06 | 124,980 | 13,030 | 6,660 | 4,600 | 149,270 | 143,440 | |
| Nov-06 | 127,530 | 13,120 | 6,580 | 4,540 | 151,770 | 146,670 | |
| Dec-06 | 133,770 | 12,920 | 7,040 | 4,580 | 158,310 | 149,510 | |
| Jan-07 | 97,580 | 9,170 | 4,720 | 3,410 | 114,880 | 148,580 | |
| Feb-07 | 96,560 | 7,580 | 4,520 | 3,610 | 112,280 | 147,120 | |
| Mar-07 | 117,970 | 11,920 | 5,940 | 3,950 | 139,770 | 144,110 | |
| Apr-07 | 105,780 | 11,700 | 5,280 | 3,690 | 126,460 | 136,980 | |
| May-07 | 117,560 | 12,750 | 5,830 | 3,970 | 140,100 | 139,920 | |
| Jun-07 | 134,370 | 16,360 | 6,880 | 4,070 | 161,680 | 139,530 | |
| Jul-07 | 128,660 | 13,290 | 6,390 | 3,050 | 151,400 | 137,980 | |
| Aug-07 | 136,790 | 15,480 | 6,860 | 3,210 | 162,330 | 137,040 | |
| Sep-07 | 109,250 | 12,270 | 5,270 | 2,420 | 129,210 | 133,260 | |
| Oct-07 | 113,080 | 12,700 | 5,660 | 2,260 | 133,700 | 124,980 | |
| Nov-07 | 112,780 | 13,810 | 5,790 | 1,940 | 134,320 | 119,940 | |
| Dec-07 | 91,140 | 10,180 | 4,940 | 1,420 | 107,680 | 109,440 | |
| Jan-08 | 67,220 | 7,800 | 3,110 | 1,220 | 79,350 | 103,660 | |
| Feb-08 | 71,820 | 7,920 | 3,430 | 1,370 | 84,540 | 99,300 | |
| Mar-08 | 68,100 | 9,080 | 3,620 | 1,250 | 82,040 | 91,920 | |
| Apr-08 | 73,130 | 9,910 | 3,810 | 1,500 | 88,350 | 94,610 | |
| May-08 | 74,470 | 10,620 | 4,000 | 1,480 | 90,560 | 87,440 | |
| Jun-08 | 69,150 | 9,580 | 3,750 | 1,300 | 83,790 | 77,280 | |
| Jul-08 | 62,400 | 8,020 | 3,130 | 1,000 | 74,560 | 66,860 | |
| Aug-08 | 57,810 | 7,830 | 2,900 | 1,020 | 69,560 | 61,820 | |
| Sep-08 | 51,080 | 6,650 | 2,670 | 930 | 61,340 | 59,130 | |
| Oct-08 | 48,080 | 8,000 | 2,650 | 820 | 59,560 | 62,890 | |
| Nov-08 | 40,020 | 5,640 | 2,150 | 890 | 48,710 | 55,610 | |
| Dec-08 | 45,860 | 5,300 | 2,440 | 860 | 54,460 | 56,400 | |
| Jan-09 | 30,460 | 3,920 | 1,460 | 640 | 36,480 | 51,660 | |
| Feb-09 | 32,510 | 3,560 | 1,650 | 680 | 38,400 | 55,930 | |
| Mar-09 | 44,900 | 4,950 | 2,580 | 1,000 | 53,430 | 63,250 | |
| Apr-09 | 44,030 | 5,220 | 2,320 | 940 | 52,520 | 62,120 | |
| May-09 | 47,410 | 5,870 | 2,510 | 990 | 56,780 | 63,760 | |
| Jun-09 | 57,100 | 6,440 | 2,890 | 1,240 | 67,670 | 67,390 | |
| Jul-09 | 62,550 | 7,110 | 3,140 | 1,290 | 74,080 | 71,810 | |
| Aug-09 | 63,910 | 6,370 | 2,940 | 1,170 | 74,390 | 75,400 | |
| Sep-09 | 62,690 | 6,630 | 3,010 | 1,210 | 73,540 | 76,470 | |
| Oct-09 | 68,730 | 7,380 | 3,340 | 1,290 | 80,740 | 80,170 | |
| Nov-09 | 66,940 | 6,950 | 3,230 | 1,290 | 78,410 | 80,640 | |
| Dec-09 | 80,940 | 7,440 | 3,790 | 1,570 | 93,740 | 98,940 | |
| Jan-10 | 39,480 | 4,370 | 1,760 | 760 | 46,370 | 64,150 | |
| Feb-10 | 45,370 | 4,010 | 2,190 | 870 | 52,440 | 76,080 | |
| Mar-10 | 55,940 | 5,720 | 2,760 | 1,130 | 65,540 | 76,000 | |
| Apr-10 | 54,330 | 6,380 | 2,800 | 1,180 | 64,680 | 68,760 | |
| May-10 | 56,580 | 5,870 | 2,890 | 1,030 | 66,380 | 71,820 | |
| Jun-10 | 66,740 | 7,230 | 3,330 | 1,260 | 78,560 | 73,030 | |
| Jul-10 | 70,410 | 7,550 | 3,340 | 1,310 | 82,610 | 74,120 | |
| Aug-10 | 66,500 | 6,540 | 3,090 | 1,220 | 77,360 | 71,850 | |
| Sep-10 | 61,920 | 6,540 | 2,840 | 1,140 | 72,440 | 71,320 | |
| Oct-10 | 60,410 | 7,020 | 3,090 | 1,200 | 71,720 | 67,270 | |
| Nov-10 | 61,400 | 6,290 | 3,160 | 1,120 | 71,960 | 65,390 | |
| Dec-10 | 60,430 | 5,600 | 3,000 | 1,000 | 70,040 | 61,970 | |
| Jan-11 | 43,050 | 3,980 | 2,020 | 790 | 49,850 | 63,610 | |
| Feb-11 | 45,870 | 3,770 | 2,270 | 880 | 52,790 | 64,420 | |
| Mar-11 | 52,830 | 5,370 | 2,680 | 1,030 | 61,920 | 65,940 | |
| Apr-11 | 53,030 | 5,790 | 2,580 | 1,050 | 62,450 | 66,920 | |
| May-11 | 54,060 | 5,700 | 2,690 | 940 | 63,390 | 66,600 | |
| Jun-11 | 58,160 | 6,640 | 2,960 | 1,040 | 68,800 | 64,570 | |
| Jul-11 | 63,510 | 7,000 | 3,060 | 1,050 | 74,620 | 68,920 | |
| Aug-11 | 62,620 | 6,610 | 3,060 | 1,060 | 73,350 | 65,440 | |
| Sep-11 | 56,470 | 7,210 | 2,740 | 1,120 | 67,540 | 62,510 | |
| Oct-11 | 59,530 | 6,170 | 2,990 | 1,130 | 69,820 | 68,610 | |
| Nov-11 | 65,630 | 6,390 | 3,410 | 1,280 | 76,720 | 70,720 | |
| Dec-11 | 67,860 | 6,110 | 3,460 | 1,190 | 78,630 | 71,700 | |
| Jan-12 | 50,230 | 4,540 | 2,240 | 960 | 57,970 | 71,780 | |
| Feb-12 | 51,750 | 4,100 | 2,450 | 1,130 | 59,430 | 69,760 | |
| Mar-12 | 59,170 | 6,830 | 2,840 | 1,050 | 69,890 | 72,140 | |
| Apr-12 | 50,900 | 5,610 | 2,710 | 930 | 60,160 | 68,080 | |
| May-12 | 55,140 | 6,110 | 2,640 | 1,010 | 64,900 | 67,380 | |
| Jun-12 | 64,720 | 7,600 | 3,300 | 1,260 | 76,880 | 69,360 | |
| Jul-12 | 63,560 | 6,140 | 2,930 | 1,080 | 73,710 | 69,440 | |
| Aug-12 | 71,490 | 7,460 | 3,450 | 1,420 | 83,820 | 71,830 | |
| Sep-12 | 58,120 | 5,830 | 2,780 | 1,170 | 67,900 | 71,140 | |
| Oct-12 | 67,580 | 6,450 | 3,430 | 1,410 | 78,880 | 72,060 | |
| Nov-12 | 76,590 | 7,090 | 3,850 | 1,570 | 89,100 | 78,260 | |
| Dec-12 | 66,220 | 6,070 | 3,360 | 1,270 | 76,920 | 75,320 | |
| Jan-13 | 55,280 | 4,610 | 2,400 | 1,150 | 63,440 | 77,480 | |
| Feb-13 | 57,000 | 4,380 | 2,720 | 1,200 | 65,300 | 79,190 | |
| Mar-13 | 69,650 | 6,380 | 3,530 | 1,480 | 81,050 | 81,680 | |
| Apr-13 | 63,850 | 6,270 | 3,060 | 1,210 | 74,390 | 85,500 | |
| May-13 | 77,670 | 7,780 | 3,770 | 1,520 | 90,730 | 89,050 | |
| Jun-13 | 75,090 | 7,800 | 3,900 | 1,520 | 88,300 | 88,270 | |
| Jul-13 | 86,740 | 7,650 | 4,170 | 1,680 | 100,250 | 90,960 | |
| Aug-13 | 89,690 | 8,700 | 4,210 | 1,800 | 104,400 | 92,080 | |
| Sep-13 | 82,960 | 7,520 | 3,970 | 1,710 | 96,160 | 96,370 | |
| Oct-13 | 88,680 | 8,110 | 4,330 | 1,820 | 102,940 | 96,120 | |
| Nov-13 | 92,420 | 9,000 | 4,540 | 2,000 | 107,950 | 97,110 | |
| Dec-13 | 92,480 | 7,310 | 4,550 | 1,910 | 106,260 | 100,460 | |
| Jan-14 | 75,360 | 6,500 | 3,330 | 1,670 | 86,870 | 99,760 | |
| Feb-14 | 73,830 | 5,680 | 3,410 | 1,660 | 84,580 | 101,980 | |
| Mar-14 | 81,470 | 6,830 | 3,880 | 1,740 | 93,920 | 104,290 | |
| Apr-14 | 82,390 | 7,590 | 3,950 | 1,740 | 95,670 | 106,160 | |
| May-14 | 86,870 | 8,830 | 4,300 | 1,980 | 101,980 | 103,880 | |
| Jun-14 | 95,100 | 8,960 | 4,590 | 2,100 | 110,750 | 106,080 | |
| Jul-14 | 96,140 | 8,160 | 4,730 | 2,000 | 111,040 | 103,470 | |
| Aug-14 | 97,670 | 9,500 | 4,600 | 2,110 | 113,880 | 103,060 | |
| Sep-14 | 86,910 | 7,870 | 3,970 | 1,860 | 100,620 | 97,100 | |
| Oct-14 | 98,500 | 9,270 | 4,750 | 2,340 | 114,860 | 100,530 | |
| Nov-14 | 84,010 | 8,640 | 4,160 | 2,050 | 98,860 | 98,730 | |
| Dec-14 | 91,150 | 6,590 | 4,580 | 2,090 | 104,400 | 94,350 | |
| Jan-15 | 67,350 | 6,270 | 3,180 | 1,590 | 78,380 | 93,010 | |
| Feb-15 | 67,890 | 5,260 | 3,180 | 1,680 | 78,010 | 93,410 | |
| Mar-15 | 67,940 | 7,700 | 3,300 | 1,520 | 80,460 | 86,340 | |
| Apr-15 | 68,200 | 7,640 | 3,340 | 1,490 | 80,670 | 90,640 | |
| May-15 | 75,590 | 7,720 | 3,640 | 1,710 | 88,660 | 93,470 | |
| Jun-15 | 91,280 | 8,650 | 4,390 | 2,080 | 106,400 | 98,340 | |
| Jul-15 | 94,370 | 9,370 | 4,560 | 2,040 | 110,330 | 96,580 | |
| Aug-15 | 89,250 | 8,430 | 4,200 | 1,910 | 103,790 | 98,280 | |
| Sep-15 | 88,160 | 7,970 | 4,100 | 2,010 | 102,240 | 100,150 | |
| Oct-15 | 93,410 | 9,060 | 4,670 | 2,190 | 109,330 | 98,700 | |
| Nov-15 | 83,720 | 8,210 | 4,210 | 1,950 | 98,080 | 93,870 | |
| Dec-15 | 91,850 | 7,850 | 4,570 | 2,010 | 106,290 | 98,550 | |
| Jan-16 | 66,780 | 5,960 | 2,990 | 1,460 | 77,200 | 94,020 | |
| Feb-16 | 76,840 | 5,310 | 3,660 | 1,650 | 87,460 | 98,750 | |
| Mar-16 | 130,600 | 10,270 | 6,120 | 2,890 | 149,880 | 149,930 | |
| Apr-16 | 55,530 | 5,820 | 2,860 | 1,300 | 65,510 | 74,820 | |
| May-16 | 66,660 | 6,270 | 3,400 | 1,560 | 77,900 | 83,850 | |
| Jun-16 | 80,410 | 7,680 | 3,990 | 1,930 | 94,010 | 89,200 | |
| Jul-16 | 82,970 | 7,830 | 4,170 | 1,820 | 96,800 | 90,000 | |
| Aug-16 | 87,360 | 7,720 | 4,430 | 1,990 | 101,500 | 89,540 | |
| Sep-16 | 81,530 | 7,880 | 4,170 | 2,030 | 95,620 | 89,110 | |
| Oct-16 | 79,310 | 7,120 | 4,190 | 1,870 | 92,480 | 90,050 | |
| Nov-16 | 82,040 | 7,740 | 4,350 | 2,070 | 96,190 | 90,010 | |
| Dec-16 | 86,370 | 7,970 | 4,740 | 2,150 | 101,230 | 90,960 | |
| Jan-17 | 65,880 | 5,620 | 3,300 | 1,640 | 76,440 | 94,380 | |
| Feb-17 | 69,550 | 5,220 | 3,510 | 1,680 | 79,960 | 94,520 | |
| Mar-17 | 82,980 | 7,760 | 4,970 | 1,990 | 97,700 | 96,570 | |
R Revised to reflect substantial amendments to tax returns data at the UK level, or changes in our seasonal adjustment methodology.
P Provisional.
1 Property transactions are allocated to the month in which the transaction was completed.
2 Not all completed transactions in the month prior to processing or the month before that will have been processed when figures for the latest month are compiled. Estimates are therefore made for the missing transactions in both the latest month and the previous month.
Month on month changes for the most recent data should not be given too much weight.
3 From April 2015 Stamp Duty Land Tax was replaced by Land and Buildings Transaction Tax in Scotland and HMRC stopped collecting data on Scotland’s transactions. HMRC are using LBTT data from Revenue Scotland to continue the series. However, there might be some discontinuities for the Scottish component of the series after April 2015. We will provide more information in future publications. Over the longer term we will review whether the series combining data in this manner meets users’ requirements
* See Reference Notes on Sheet 7
Non-residential property transaction completions (Historic Table)
Annual, Quarterly and Monthly Tables
| Number of non-residential property transaction completions with value £40,000 or above1 2 3 | |||||||
| Not seasonally adjusted* | Seasonally adjusted* | ||||||
|---|---|---|---|---|---|---|---|
| England | Scotland | Wales | Northern Ireland | UK | UK | ||
| Annual (financial year) | |||||||
| 2005-06 | 112,700 | 10,180 | 6,190 | 5,060 | 134,130 | 133,380 | |
| 2006-07 | 113,310 | 11,120 | 6,440 | 5,350 | 136,230 | 136,830 | |
| 2007-08 | 114,560 | 12,320 | 6,330 | 4,600 | 137,810 | 138,370 | |
| 2008-09 | 71,010 | 9,430 | 3,990 | 2,170 | 86,600 | 102,920 | |
| 2009-10 | 52,910 | 7,800 | 2,800 | 1,310 | 64,820 | 92,000 | |
| 2010-11 | 61,510 | 8,350 | 3,210 | 1,490 | 74,560 | 74,860 | |
| 2011-12 | 56,180 | 8,000 | 2,890 | 1,330 | 68,390 | 68,560 | |
| 2012-13 | 61,930 | 8,030 | 3,050 | 1,610 | 74,620 | 74,310 | |
| 2013-14 | 73,470 | 8,760 | 3,710 | 2,080 | 88,010 | 88,050 | |
| 2014-15 | 76,640 | 9,600 | 3,960 | 2,280 | 92,480 | 92,360 | |
| 2015-16 | 76,990 | 6,180 | 3,980 | 2,510 | 89,670 | 89,220 | |
| 2016-17 | 83,710 | 5,870 | 4,440 | 2,820 | 96,850 | 96,880 | |
| Annual (calendar year) | |||||||
| 2006 | 113,030 | 10,870 | 6,320 | 5,210 | 135,430 | 135,570 | |
| 2007 | 115,280 | 12,300 | 6,420 | 5,000 | 139,000 | 139,100 | |
| 2008 | 90,210 | 10,560 | 5,090 | 2,880 | 108,740 | 116,610 | |
| 2009 | 48,160 | 7,770 | 2,540 | 1,200 | 59,680 | 87,960 | |
| 2010 | 60,010 | 8,360 | 3,130 | 1,460 | 72,950 | 80,810 | |
| 2011 | 57,430 | 7,960 | 3,020 | 1,340 | 69,740 | 70,180 | |
| 2012 | 58,630 | 8,030 | 2,900 | 1,510 | 71,080 | 70,870 | |
| 2013 | 72,070 | 8,510 | 3,580 | 2,000 | 86,160 | 85,780 | |
| 2014 | 77,400 | 9,490 | 3,960 | 2,290 | 93,140 | 92,950 | |
| 2015 | 75,540 | 7,010 | 3,970 | 2,440 | 88,960 | 89,220 | |
| 2016 | 81,150 | 5,860 | 4,310 | 2,740 | 94,050 | 93,950 | |
| Quarterly (calendar year) | |||||||
| 2005-Q2 | 27,780 | 2,390 | 1,510 | 1,350 | 33,030 | 32,860 | |
| 2005-Q3 | 28,630 | 2,440 | 1,600 | 1,230 | 33,900 | 34,170 | |
| 2005-Q4 | 27,830 | 2,590 | 1,560 | 1,280 | 33,260 | 32,810 | |
| 2006-Q1 | 28,470 | 2,750 | 1,520 | 1,200 | 33,940 | 33,540 | |
| 2006-Q2 | 28,120 | 2,570 | 1,620 | 1,400 | 33,710 | 33,790 | |
| 2006-Q3 | 27,250 | 2,530 | 1,470 | 1,150 | 32,400 | 33,530 | |
| 2006-Q4 | 29,190 | 3,020 | 1,700 | 1,460 | 35,370 | 34,700 | |
| 2007-Q1 | 28,750 | 3,010 | 1,640 | 1,340 | 34,740 | 34,800 | |
| 2007-Q2 | 28,480 | 3,170 | 1,590 | 1,450 | 34,700 | 34,840 | |
| 2007-Q3 | 28,640 | 2,930 | 1,540 | 1,180 | 34,290 | 35,170 | |
| 2007-Q4 | 29,410 | 3,190 | 1,640 | 1,030 | 35,270 | 34,290 | |
| 2008-Q1 | 28,040 | 3,020 | 1,550 | 940 | 33,550 | 34,080 | |
| 2008-Q2 | 27,560 | 3,090 | 1,670 | 1,000 | 33,320 | 33,170 | |
| 2008-Q3 | 22,860 | 2,290 | 1,260 | 620 | 27,020 | 26,990 | |
| 2008-Q4 | 11,760 | 2,160 | 620 | 320 | 14,860 | 22,380 | |
| 2009-Q1 | 8,840 | 1,890 | 450 | 230 | 11,400 | 20,380 | |
| 2009-Q2 | 11,240 | 1,900 | 620 | 300 | 14,060 | 20,600 | |
| 2009-Q3 | 13,200 | 1,900 | 680 | 320 | 16,100 | 22,860 | |
| 2009-Q4 | 14,880 | 2,090 | 790 | 360 | 18,120 | 24,120 | |
| 2010-Q1 | 13,580 | 1,920 | 700 | 340 | 16,540 | 24,420 | |
| 2010-Q2 | 15,480 | 2,250 | 820 | 390 | 18,940 | 19,470 | |
| 2010-Q3 | 15,500 | 2,100 | 820 | 340 | 18,760 | 19,350 | |
| 2010-Q4 | 15,450 | 2,090 | 780 | 390 | 18,710 | 17,570 | |
| 2011-Q1 | 15,080 | 1,920 | 790 | 360 | 18,150 | 18,470 | |
| 2011-Q2 | 14,210 | 1,980 | 780 | 340 | 17,320 | 17,780 | |
| 2011-Q3 | 13,280 | 2,030 | 690 | 290 | 16,290 | 16,470 | |
| 2011-Q4 | 14,860 | 2,030 | 760 | 340 | 18,000 | 17,460 | |
| 2012-Q1 | 13,830 | 1,960 | 650 | 360 | 16,800 | 16,850 | |
| 2012-Q2 | 14,230 | 2,030 | 710 | 390 | 17,360 | 17,760 | |
| 2012-Q3 | 14,090 | 1,960 | 680 | 370 | 17,100 | 17,600 | |
| 2012-Q4 | 16,480 | 2,090 | 860 | 400 | 19,830 | 18,650 | |
| 2013-Q1 | 17,130 | 1,950 | 800 | 460 | 20,340 | 20,290 | |
| 2013-Q2 | 16,630 | 2,060 | 870 | 530 | 20,090 | 20,780 | |
| 2013-Q3 | 18,360 | 2,120 | 930 | 490 | 21,900 | 22,240 | |
| 2013-Q4 | 19,950 | 2,370 | 980 | 530 | 23,840 | 22,460 | |
| 2014-Q1 | 18,520 | 2,200 | 930 | 530 | 22,180 | 22,560 | |
| 2014-Q2 | 19,470 | 2,300 | 1,000 | 620 | 23,400 | 23,880 | |
| 2014-Q3 | 18,840 | 2,430 | 970 | 490 | 22,740 | 23,070 | |
| 2014-Q4 | 20,560 | 2,560 | 1,060 | 640 | 24,820 | 23,430 | |
| 2015-Q1 | 17,770 | 2,320 | 930 | 520 | 21,530 | 21,980 | |
| 2015-Q2 | 18,460 | 1,480 | 1,030 | 680 | 21,650 | 22,060 | |
| 2015-Q3 | 19,890 | 1,530 | 1,010 | 630 | 23,060 | 23,460 | |
| 2015-Q4 | 19,420 | 1,690 | 990 | 620 | 22,720 | 21,720 | |
| 2016-Q1 | 19,220 | 1,490 | 950 | 590 | 22,250 | 21,980 | |
| 2016-Q2 | 20,270 | 1,450 | 1,090 | 740 | 23,550 | 24,350 | |
| 2016-Q3 | 20,150 | 1,320 | 1,180 | 620 | 23,260 | 23,400 | |
| 2016-Q4 | 21,510 | 1,590 | 1,100 | 800 | 24,990 | 24,230 | |
| 2017-Q1 | 21,780 | 1,510 | 1,080 | 670 | 25,040 | 24,900 | |
| Monthly | |||||||
| Apr-05 | 9,200 | 800 | 510 | 410 | 10,910 | 10,410 | |
| May-05 | 8,620 | 810 | 480 | 470 | 10,380 | 11,160 | |
| Jun-05 | 9,960 | 790 | 520 | 470 | 11,740 | 11,300 | |
| Jul-05 | 10,120 | 880 | 550 | 450 | 12,000 | 12,220 | |
| Aug-05 | 9,100 | 770 | 540 | 360 | 10,780 | 11,090 | |
| Sep-05 | 9,410 | 800 | 500 | 420 | 11,120 | 10,860 | |
| Oct-05 | 8,710 | 770 | 490 | 410 | 10,370 | 10,970 | |
| Nov-05 | 9,400 | 900 | 520 | 440 | 11,260 | 10,700 | |
| Dec-05 | 9,720 | 920 | 540 | 430 | 11,620 | 11,140 | |
| Jan-06 | 8,610 | 780 | 450 | 350 | 10,200 | 11,280 | |
| Feb-06 | 7,870 | 750 | 440 | 340 | 9,410 | 11,120 | |
| Mar-06 | 11,980 | 1,220 | 630 | 500 | 14,340 | 11,150 | |
| Apr-06 | 9,270 | 860 | 530 | 460 | 11,110 | 11,630 | |
| May-06 | 8,660 | 820 | 510 | 460 | 10,450 | 10,940 | |
| Jun-06 | 10,190 | 900 | 590 | 470 | 12,150 | 11,210 | |
| Jul-06 | 8,720 | 760 | 510 | 370 | 10,360 | 11,140 | |
| Aug-06 | 9,030 | 930 | 480 | 370 | 10,810 | 11,050 | |
| Sep-06 | 9,500 | 840 | 480 | 410 | 11,230 | 11,340 | |
| Oct-06 | 9,420 | 1,010 | 590 | 450 | 11,480 | 11,230 | |
| Nov-06 | 9,770 | 1,020 | 560 | 490 | 11,840 | 11,680 | |
| Dec-06 | 10,000 | 990 | 550 | 520 | 12,060 | 11,790 | |
| Jan-07 | 9,020 | 870 | 520 | 380 | 10,790 | 11,650 | |
| Feb-07 | 8,110 | 860 | 480 | 420 | 9,870 | 11,670 | |
| Mar-07 | 11,620 | 1,270 | 640 | 540 | 14,080 | 11,490 | |
| Apr-07 | 9,220 | 1,020 | 530 | 480 | 11,250 | 11,430 | |
| May-07 | 9,110 | 1,060 | 520 | 490 | 11,180 | 11,650 | |
| Jun-07 | 10,160 | 1,100 | 540 | 480 | 12,270 | 11,750 | |
| Jul-07 | 9,840 | 920 | 530 | 420 | 11,720 | 11,650 | |
| Aug-07 | 9,860 | 1,060 | 520 | 420 | 11,860 | 11,980 | |
| Sep-07 | 8,940 | 950 | 490 | 340 | 10,720 | 11,550 | |
| Oct-07 | 10,040 | 1,040 | 600 | 410 | 12,090 | 11,470 | |
| Nov-07 | 10,270 | 1,190 | 540 | 340 | 12,340 | 11,610 | |
| Dec-07 | 9,100 | 960 | 500 | 280 | 10,850 | 11,210 | |
| Jan-08 | 8,910 | 870 | 490 | 320 | 10,580 | 11,440 | |
| Feb-08 | 8,640 | 940 | 450 | 290 | 10,330 | 11,250 | |
| Mar-08 | 10,480 | 1,210 | 620 | 330 | 12,640 | 11,390 | |
| Apr-08 | 11,460 | 1,220 | 720 | 450 | 13,850 | 13,010 | |
| May-08 | 8,020 | 950 | 500 | 270 | 9,740 | 10,470 | |
| Jun-08 | 8,070 | 920 | 450 | 280 | 9,730 | 9,690 | |
| Jul-08 | 8,090 | 770 | 440 | 240 | 9,530 | 9,160 | |
| Aug-08 | 6,810 | 710 | 390 | 190 | 8,100 | 8,680 | |
| Sep-08 | 7,960 | 810 | 420 | 190 | 9,380 | 9,160 | |
| Oct-08 | 4,380 | 800 | 220 | 120 | 5,520 | 8,110 | |
| Nov-08 | 3,410 | 660 | 190 | 100 | 4,370 | 7,160 | |
| Dec-08 | 3,960 | 690 | 210 | 100 | 4,960 | 7,100 | |
| Jan-09 | 2,430 | 580 | 130 | 60 | 3,210 | 6,830 | |
| Feb-09 | 1,760 | 540 | 90 | 40 | 2,440 | 6,740 | |
| Mar-09 | 4,650 | 760 | 220 | 120 | 5,750 | 6,810 | |
| Apr-09 | 3,970 | 600 | 210 | 100 | 4,880 | 6,710 | |
| May-09 | 3,210 | 640 | 200 | 90 | 4,140 | 6,800 | |
| Jun-09 | 4,060 | 660 | 220 | 100 | 5,040 | 7,090 | |
| Jul-09 | 4,290 | 600 | 230 | 100 | 5,220 | 7,430 | |
| Aug-09 | 4,440 | 590 | 230 | 90 | 5,340 | 7,780 | |
| Sep-09 | 4,480 | 710 | 220 | 130 | 5,540 | 7,650 | |
| Oct-09 | 4,770 | 680 | 240 | 120 | 5,810 | 7,850 | |
| Nov-09 | 5,160 | 720 | 260 | 130 | 6,270 | 8,040 | |
| Dec-09 | 4,960 | 690 | 280 | 110 | 6,040 | 8,220 | |
| Jan-10 | 3,840 | 530 | 190 | 100 | 4,670 | 7,630 | |
| Feb-10 | 3,850 | 560 | 200 | 100 | 4,700 | 8,400 | |
| Mar-10 | 5,890 | 830 | 310 | 140 | 7,170 | 8,390 | |
| Apr-10 | 4,750 | 720 | 240 | 120 | 5,840 | 5,860 | |
| May-10 | 4,850 | 710 | 270 | 130 | 5,960 | 6,710 | |
| Jun-10 | 5,880 | 820 | 310 | 130 | 7,140 | 6,890 | |
| Jul-10 | 5,440 | 750 | 300 | 120 | 6,600 | 6,870 | |
| Aug-10 | 5,000 | 660 | 270 | 120 | 6,060 | 6,200 | |
| Sep-10 | 5,060 | 680 | 250 | 100 | 6,100 | 6,280 | |
| Oct-10 | 5,020 | 740 | 280 | 120 | 6,150 | 6,220 | |
| Nov-10 | 5,620 | 690 | 290 | 140 | 6,750 | 5,930 | |
| Dec-10 | 4,820 | 660 | 210 | 130 | 5,820 | 5,430 | |
| Jan-11 | 4,620 | 510 | 210 | 100 | 5,430 | 6,190 | |
| Feb-11 | 4,720 | 600 | 260 | 140 | 5,720 | 6,360 | |
| Mar-11 | 5,740 | 820 | 310 | 120 | 6,990 | 5,920 | |
| Apr-11 | 4,690 | 620 | 270 | 110 | 5,700 | 5,970 | |
| May-11 | 4,890 | 670 | 240 | 130 | 5,930 | 6,100 | |
| Jun-11 | 4,630 | 680 | 270 | 100 | 5,690 | 5,710 | |
| Jul-11 | 4,500 | 640 | 260 | 100 | 5,480 | 5,700 | |
| Aug-11 | 4,230 | 680 | 210 | 90 | 5,210 | 5,170 | |
| Sep-11 | 4,550 | 720 | 220 | 110 | 5,600 | 5,600 | |
| Oct-11 | 4,440 | 650 | 230 | 100 | 5,420 | 5,570 | |
| Nov-11 | 5,510 | 720 | 300 | 120 | 6,650 | 5,920 | |
| Dec-11 | 4,910 | 660 | 230 | 120 | 5,930 | 5,980 | |
| Jan-12 | 4,880 | 590 | 220 | 120 | 5,810 | 6,040 | |
| Feb-12 | 4,570 | 600 | 210 | 130 | 5,510 | 5,840 | |
| Mar-12 | 4,390 | 760 | 220 | 100 | 5,480 | 4,970 | |
| Apr-12 | 5,380 | 620 | 290 | 130 | 6,420 | 6,490 | |
| May-12 | 4,310 | 790 | 200 | 130 | 5,430 | 5,630 | |
| Jun-12 | 4,540 | 620 | 220 | 130 | 5,510 | 5,640 | |
| Jul-12 | 4,610 | 650 | 210 | 120 | 5,580 | 5,400 | |
| Aug-12 | 5,010 | 680 | 240 | 120 | 6,050 | 6,130 | |
| Sep-12 | 4,470 | 620 | 230 | 130 | 5,460 | 6,060 | |
| Oct-12 | 5,700 | 700 | 310 | 150 | 6,870 | 6,230 | |
| Nov-12 | 6,120 | 750 | 350 | 140 | 7,350 | 6,670 | |
| Dec-12 | 4,660 | 640 | 200 | 110 | 5,610 | 5,740 | |
| Jan-13 | 5,180 | 550 | 240 | 140 | 6,110 | 6,440 | |
| Feb-13 | 4,900 | 590 | 230 | 150 | 5,860 | 6,510 | |
| Mar-13 | 7,060 | 820 | 330 | 170 | 8,370 | 7,340 | |
| Apr-13 | 6,000 | 690 | 320 | 200 | 7,200 | 7,220 | |
| May-13 | 5,620 | 750 | 290 | 190 | 6,840 | 7,040 | |
| Jun-13 | 5,010 | 630 | 260 | 140 | 6,050 | 6,520 | |
| Jul-13 | 6,500 | 720 | 330 | 180 | 7,730 | 7,290 | |
| Aug-13 | 5,650 | 700 | 280 | 150 | 6,780 | 7,430 | |
| Sep-13 | 6,210 | 700 | 320 | 160 | 7,390 | 7,520 | |
| Oct-13 | 6,430 | 730 | 350 | 160 | 7,670 | 7,210 | |
| Nov-13 | 6,570 | 850 | 300 | 190 | 7,910 | 7,570 | |
| Dec-13 | 6,950 | 790 | 340 | 190 | 8,260 | 7,680 | |
| Jan-14 | 5,610 | 690 | 260 | 190 | 6,750 | 7,060 | |
| Feb-14 | 5,350 | 700 | 270 | 130 | 6,460 | 7,160 | |
| Mar-14 | 7,560 | 810 | 400 | 210 | 8,980 | 8,340 | |
| Apr-14 | 6,690 | 730 | 350 | 220 | 8,000 | 7,770 | |
| May-14 | 5,730 | 760 | 300 | 190 | 6,990 | 7,810 | |
| Jun-14 | 7,050 | 800 | 350 | 210 | 8,410 | 8,300 | |
| Jul-14 | 6,960 | 840 | 350 | 170 | 8,310 | 8,140 | |
| Aug-14 | 6,070 | 740 | 310 | 180 | 7,300 | 7,960 | |
| Sep-14 | 5,820 | 860 | 310 | 140 | 7,120 | 6,970 | |
| Oct-14 | 7,120 | 920 | 370 | 230 | 8,640 | 8,000 | |
| Nov-14 | 6,080 | 810 | 330 | 190 | 7,400 | 7,500 | |
| Dec-14 | 7,360 | 830 | 360 | 230 | 8,780 | 7,930 | |
| Jan-15 | 5,850 | 640 | 300 | 150 | 6,930 | 7,880 | |
| Feb-15 | 5,530 | 680 | 300 | 200 | 6,700 | 7,420 | |
| Mar-15 | 6,390 | 1,000 | 340 | 170 | 7,900 | 6,670 | |
| Apr-15 | 5,970 | 550 | 350 | 210 | 7,080 | 7,170 | |
| May-15 | 5,560 | 440 | 300 | 220 | 6,530 | 7,310 | |
| Jun-15 | 6,930 | 480 | 370 | 250 | 8,040 | 7,590 | |
| Jul-15 | 6,710 | 500 | 350 | 220 | 7,780 | 7,560 | |
| Aug-15 | 6,190 | 520 | 340 | 170 | 7,220 | 7,970 | |
| Sep-15 | 6,980 | 510 | 330 | 230 | 8,050 | 7,930 | |
| Oct-15 | 6,770 | 500 | 360 | 190 | 7,820 | 7,820 | |
| Nov-15 | 5,800 | 540 | 280 | 170 | 6,790 | 6,300 | |
| Dec-15 | 6,860 | 650 | 350 | 260 | 8,110 | 7,600 | |
| Jan-16 | 5,380 | 410 | 240 | 160 | 6,200 | 7,060 | |
| Feb-16 | 6,410 | 420 | 290 | 200 | 7,310 | 7,690 | |
| Mar-16 | 7,430 | 660 | 410 | 230 | 8,740 | 7,230 | |
| Apr-16 | 6,490 | 490 | 350 | 240 | 7,570 | 8,110 | |
| May-16 | 6,510 | 460 | 340 | 270 | 7,580 | 7,890 | |
| Jun-16 | 7,270 | 500 | 390 | 230 | 8,400 | 8,350 | |
| Jul-16 | 6,390 | 430 | 350 | 180 | 7,350 | 7,690 | |
| Aug-16 | 6,990 | 440 | 450 | 240 | 8,130 | 7,890 | |
| Sep-16 | 6,770 | 450 | 380 | 190 | 7,790 | 7,820 | |
| Oct-16 | 7,040 | 430 | 350 | 260 | 8,080 | 8,170 | |
| Nov-16 | 7,560 | 550 | 390 | 300 | 8,800 | 7,930 | |
| Dec-16 | 6,910 | 610 | 350 | 230 | 8,110 | 8,130 | |
| Jan-17 | 6,760 | 400 | 300 | 210 | 7,680 | 8,130 | |
| Feb-17 | 6,600 | 440 | 340 | 220 | 7,590 | 8,460 | |
| Mar-17 | 8,420 | 670 | 440 | 240 | 9,770 | 8,310 | |
R Revised to reflect substantial amendments to tax returns data at the UK level, or changes in our seasonal adjustment methodology.
P Provisional.
1 Property transactions are allocated to the month in which the transaction was completed.
2 Not all completed transactions in the month prior to processing or the month before that will have been processed when figures for the latest month are compiled. Estimates are therefore made for the missing transactions in both the latest month and the previous month.
Month on month changes for the most recent data should not be given too much weight.
3 From April 2015 Stamp Duty Land Tax was replaced by Land and Buildings Transaction Tax in Scotland and HMRC stopped collecting data on Scotland’s transactions. HMRC are using LBTT data from Revenue Scotland to continue the series. However, there might be some discontinuities for the Scottish component of the series after April 2015. We will provide more information in future publications. Over the longer term we will review whether the series combining data in this manner meets users’ requirements
* See Reference Notes on Sheet 7
Section 2: Reference
Background, Methodology, Explanations and Contacts
Property Transaction Taxes Background
Stamp Duty Land Tax (SDLT) is payable on the purchase or transfer of most property or land in England, Wales, and Northern Ireland. Land and Buildings Transaction Tax (LBTT) is the equivalent tax payable in Scotland. Both the SDLT and LBTT due on a transaction is calculated from the amount paid for the property with higher rates applied to higher value transactions though with different rates and thresholds.
Some transactions will qualify for a relief or exemption.
Different rates and thresholds will also apply depending on whether the property is being used for residential or non-residential purposes, and whether the property is sold as a freehold or leasehold.
Most UK land and property transactions will be notified to HM Revenue & Customs (HMRC) directly on a Stamp Duty Land Tax return - even if no tax is due. Transactions with value less than £40,000 do not need to be notified. Transactions in Scotland need to be notified to the Scottish Administration.
SDLT replaced Stamp Duty on Land and Property on 1 December 2003. LBTT replaced SDLT in Scotland on 1 April 2015.
More information about SDLT, LBTT, the rates and thresholds, the reliefs available, and the definitions of residential and non-residential can be found on the HMRC website (follow the hyperlinks in section 7.5).
Introduction to Statistics: Methodology & Explanation
This publication presents monthly estimates of the number of residential and non-residential property transactions in the UK and its constituent countries.
Data Sources:
The tables in this publication are based on two sources. HMRC’s Stamp Duty Land Tax database and the Scottish Administration’s LBTT database. Not all property transactions are captured in these databases. As well as transactions where the chargeable consideration is less than £40,000, other instances where no notification is required include transfers in connection with divorce and some grants of leases of less than 7 years.
Rounding:
All figures in the tables are estimates that are rounded to the nearest ten to indicate the level of uncertainty (see Country Breakdowns for more information).
Revisions and Timing of Publication:
Transactions are recorded in the database by the date of completion and are presented on that basis in this publication. However, purchasers have 30 days from the date of completion to submit their land transaction return before incurring a penalty. To produce the monthly property transaction figures in time for publication each month, a ‘snapshot’ of the relevant database is taken in the second week of the month. The date of this snapshot is maintained in order to provide consistency and is selected to provide users with the best balance between accurate and timely estimates.
The first publication of the latest estimates is timed to complement housing market data from other sources, which are released within a similar timeframe. Section 7.5 contains links to some related statistics.
Therefore at the time of first release, estimates for the most recent month are based on incomplete data and need to be adjusted upward to compensate. This adjustment is based upon the difference between initial and final estimates in previous months.
A similar but smaller adjustment is also made to the penultimate month.
From May 2016, the adjustment factor for Scottish transactions in the most recent month has been separately calculated using data from the LBTT database.
For this reason, all figures in the tables on pages 2, 3, 5 and 6 for the most recent three months are routinely marked as provisional and are subject to significant revision in subsequent publications.
The table on page 8 shows the average absolute percentage revision between initial and final property transaction estimates. These are the average amounts that provisional figures can be expected to change before they become final, which gives an indication of the size (but not direction) of the uncertainty in the latest estimates.
Estimates for earlier time periods may also change slightly between publications as late returns are received and corrections are made to the SDLT and LBTT databases. Additionally, in November 2016 there were minor revisions made to previously published transaction figures as a result of our review into our seasonal adjustment model.
Country Breakdowns:
The split of property transactions between England, Wales and Northern Ireland is based upon the location of the property. There are a small minority of cases where this information is not recorded and these transactions are allocated to a country on a pro-rata basis to maintain the recorded proportions. The data for Scotland is provided separately by the Scottish Administration.
Seasonal Adjustment:
The number of property transactions in the UK is highly seasonal, with more activity in the summer months and less in the winter. This regular annual pattern can sometimes mask the underlying movements and trends in the data series so the publication also presents the UK aggregate transaction figures on a seasonally adjusted basis. The country breakdowns are also seasonal but are not currently seasonally adjusted.
The seasonally adjusted series are estimated using the X13 ARIMA software, as is standard across National Statistics. Adjustments are made for both the time of year and the construction of the calendar, including corrections for the position of Easter and the number of trading days in a particular month.
Statistical Quality
HMRC’s statement on statistical quality is published in “HMRC: Official Statistics” on the HMRC website (hyperlinked in section 7.5).
These statistics are based on an administrative data source collected by HMRC in the running of its business (collecting tax). Any apparent discrepancy between totals and the sum of the constituents in the bulletin is due to rounding.
The quality of these statistics depends on the purpose that they are intended to be used for. The definitions used within this publication are defined by tax law, and whether or not a property transaction is counted within the estimates is dependent on the submission of a Land Transaction Return. Transactions where no return is required, or is required but not submitted, will not be counted in the estimates. The statistics will therefore provide a good indication of the trend in the numbers of residential and non-residential property transactions but may not accurately reflect the total number of properties bought, sold or transferred.
Related Statistics
HMRC publish more detailed breakdowns of the number and value of property transactions on an annual basis. These National Statistics can be found alongside the Monthly Property Transactions publication on the HMRC website (see hyperlink section).
HMRC publish annual tables of Stamp Duty Land Tax collected, which is taken from the same data source as the transactions data. This is broken down into small geographical units including by Local Authority and by parliamentary constituency (a link can be found in section 7.5).
There are many other National and Official Statistics publications relevant to the UK housing market. The Valuation Office Agency (VOA) publishes statistics on council tax and on the private rental market. The Office for National Statistics (ONS) and HM Land Registry both produce statistics on UK House Prices. The Dept. for Communities and Local Government (DCLG) released a variety of publications on housing and associated topics (links to the relevant website can be found in the hyperlink section). Revenue Scotland publish figures on transactions liable for LBTT. These figures have a different basis and so should not be considered entirely comparable with the estimates produced here.
Hyperlinks
Useful Links
Introduction to SDLT:
https://www.gov.uk/stamp-duty-land-tax-the-basics#1
Current SDLT Rates and Thresholds:
https://www.gov.uk/government/publications/rates-and-allowances-stamp-duty-land-tax
Introduction to LBTT:
https://www.revenue.scot/land-buildings-transaction-tax
Historic SDLT Rates and Thresholds:
http://webarchive.nationalarchives.gov.uk/*/http://www.hmrc.gov.uk/statistics/stamp-duty/table-a9.xls
Land Transaction Return Guidance Notes:
https://www.gov.uk/government/publications/sdlt-guide-for-completing-paper-sdlt1-return
Statement of Administrative Sources general note:
https://www.gov.uk/government/uploads/system/uploads/attachment_data/file/278306/cop-admin-sources_1_.pdf
X13ARIMA homepage:
http://www.census.gov/srd/www/x13as/
HMRC: Official Statistics
https://www.gov.uk/government/organisations/hm-revenue-customs/about/statistics
HMRC Annual Report and Resource Accounts
https://www.gov.uk/government/publications/hmrc-annual-report-and-accounts-2013-to-2014
Related Statistics
Archived versions of the Monthly Property Transactions:
http://webarchive.nationalarchives.gov.uk/*/http:/hmrc.gov.uk/thelibrary/national-statistics.htm
Historic Property Transactions, Monthly, Quarterly and Annual, 1959 to 2005 (Table 5.5)
http://www.ons.gov.uk/ons/rel/elmr/economic-trends--discontinued-/2006-edition/index.html
Annual Property Transactions Publication (discontinued):
https://www.gov.uk/government/collections/property-transactions-in-the-uk
Stamp Duties collected (T15.1 to T15.5):
https://www.gov.uk/government/collections/stamp-duties-statistics
Measuring Tax Gaps:
https://www.gov.uk/government/publications/measuring-tax-gaps-tables
Tax expenditures and ready reckoners:
https://www.gov.uk/government/collections/tax-expenditures-and-ready-reckoners
ONS House Price Index:
http://www.ons.gov.uk/economy/inflationandpriceindices/publications
Valuation Office Agency statistics:
https://www.gov.uk/government/statistics?departments%5B%5D=valuation-office-agency
HM Land Registry statistics:
https://www.gov.uk/government/publications/about-the-house-price-index
Dept. for Communities and Local Government statistics:
https://www.gov.uk/government/organisations/department-for-communities-and-local-government/series/housing-market
Revenue Scotland Statistics:
https://www.revenue.scot/about-us/publications/statistics
Other links
Office for National Statistics (ONS):
http://www.ons.gov.uk/ons/index.html
Office for Budget Responsibility (OBR):
http://budgetresponsibility.independent.gov.uk/
UK Statistics Authority:
http://www.statisticsauthority.gov.uk/
Changes and Revisions
Changes to Duty Rates and Statement of Revisions
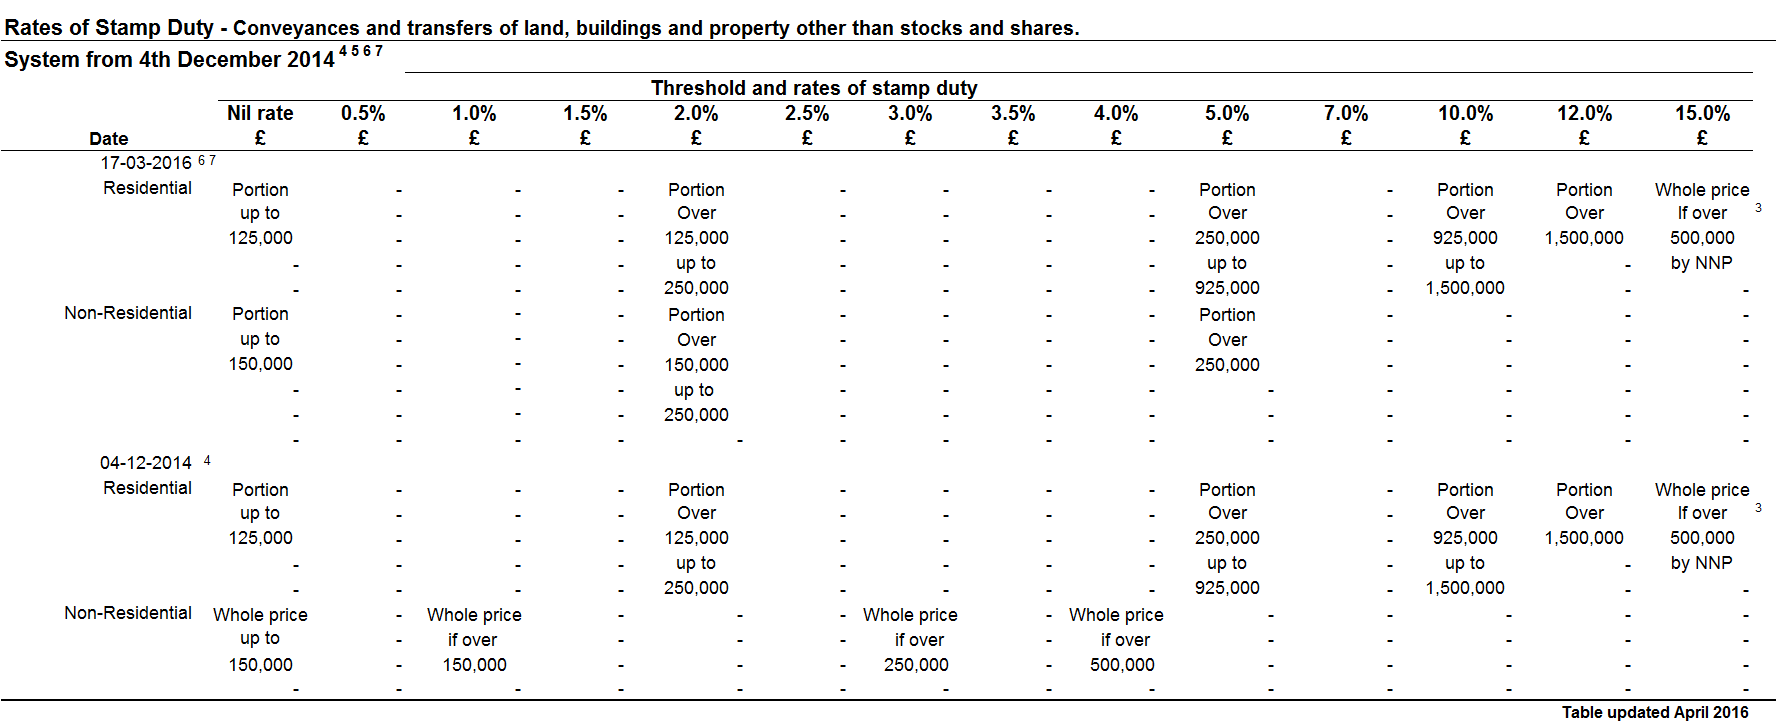
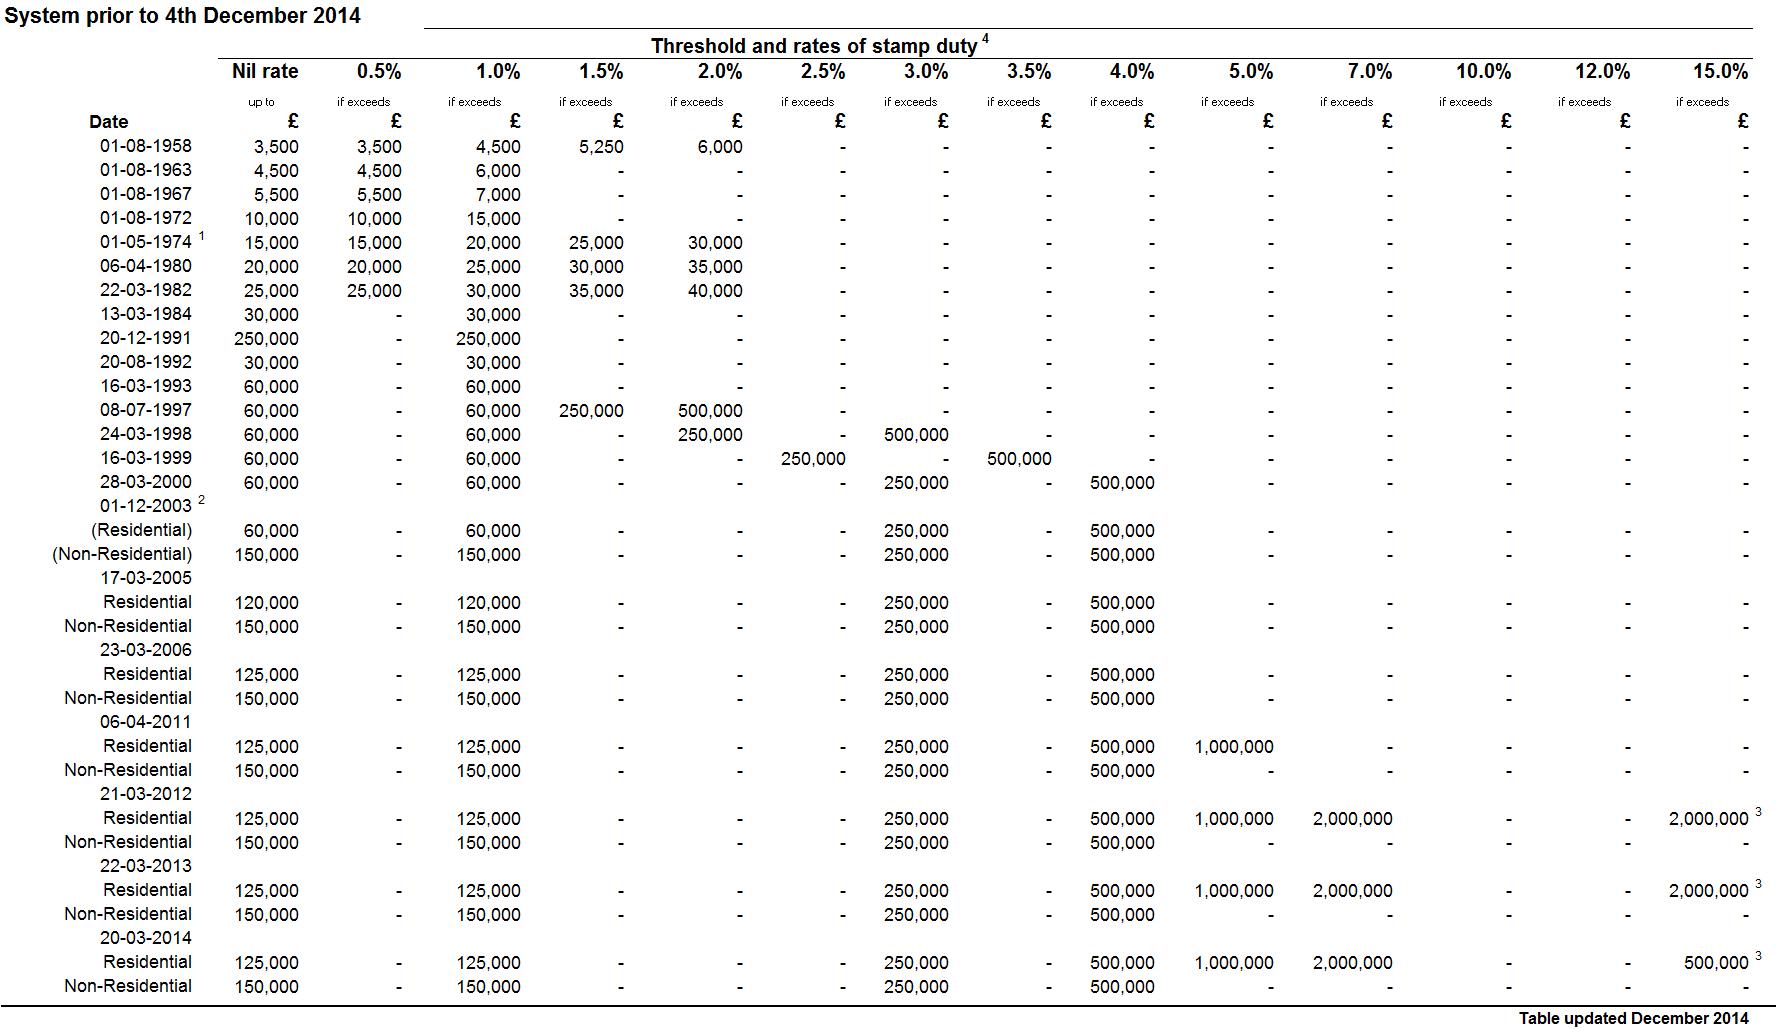
Reference Notes (for both Rates of Stamp Duty tables above)
1 Northern Ireland 1 August 1974.
2 From the 1st December 2003 separate starting rates were applied to residential and commercial transactions:
i residential property transactions, consist mainly of home purchases but also include other transactions which cannot be regarded as purchases for owner occupation e.g. the separate purchase of a private garage or the purchase of the freehold by the leaseholder;
ii commercial property covers all land and commercial and industrial property e.g. shops, commercial garages, hotels, public houses etc.
3 Higher rate for corporate bodies - From 20 March 2014 SDLT is charged at 15 per cent on interests in residential dwellings costing more than £500,000 purchased by certain non-natural persons (NNP). Previously (From 21 March 2012) the threshold had been £2 million. This broadly includes bodies corporate, for example companies, collective investment schemes and all partnerships with one or more members who are either a body corporate or a collective investment scheme. There are exclusions for companies acting in their capacity as trustees for a settlement and property developers who meet certain conditions.
4From 4 December 2014, SDLT for residential property is charged at different rates depending on the portion of the purchase price that falls within each rate band.
5 SDLT is no longer payable in Scotland and has been replaced with Land and Buildings Transaction Tax
6 From 17 March 2016, SDLT for non-residential property is charged at different rates depending on the portion of the purchase price that falls within each rate band.
7 From 1 April 2016, those purchasing additional residential properties are liable to pay an additional 3% on top of the current residential SDLT marginal rates.
Average Revisions
This table shows the monthly average percentage revision (over the 36 months of data covering 2012-13 to 2014-15) between initial and non-provisional property transaction estimates, broken down into non-seasonally adjusted residential and non-residential categories. These are the average amounts that provisional figures can be expected to change before they become final, which gives an indication of the size (but not direction) of the uncertainty in the latest estimates. Note that there is greater uncertainty in the non-residential estimates as there tends to be a greater lag between completion of a transaction and receipt of the Land Transaction Return.
For information on the methodology used and the causes of revisions see section 7.2 on page 7.

Other Information
Contact point for statistical enquiries
Mark Dickson
KAI Indirect Taxes, Customs & Coordination
HM Revenue & Customs
Room 3E/10
100 Parliament Street
London
SW1A 2BQ
Tel: 03000 515 305
Email: revenuemonitoring@hmrc.gsi.gov.uk
For more general enquiries please refer to the HMRC website:
https://www.gov.uk/government/organisations/hm-revenue-customs
or contact the Stamp Taxes Helpline on 0300 200 3510.
https://www.gov.uk/government/organisations/hm-revenue-customs/contact/stamp-duty-land-tax
Publication Calendar
Publications will be released on the 21st of each month, but are delayed by one day whenever the 21st or the day preceding the 21st is a non-working day (e.g. publications are never published on a Monday, Saturday or Sunday).
This release, for April 2017, was published on 23 May 2017 at 9:30am. The next release, for May 2017, will be published on 21 June 2017 at 9:30am.
Historic releases of property publications can be found on the National Archives website:
http://webarchive.nationalarchives.gov.uk/*/http://www.hmrc.gov.uk/stats/survey_of_prop/menu.htm
The full publication calendar can be found on the ‘scheduled updates’ page of the HMRC website:
https://www.gov.uk/government/organisations/hm-revenue-customs/about/statistics
And is also published on the Publication Hub for UK National Statistics:
https://www.gov.uk/government/statistics/announcements
Revisions Policy for the UK Property Transactions Count publication
Any months with revisions are marked with an ‘R’ where appropriate and significant revisions will be explained in the notes sections on pages 2 and 3.
All statistics are provisional for the first three months of publication and revisions are marked when the previous months figure and finalised figure (at the third month of publication) are changed.
For further information on revisions policy see section 7.2 ‘Introduction to Statistics: Methodology & Explanation’.
Reference: National Statistics Publications for Indirect Taxes
Meeting user needs
We are committed to improving the official statistics we publish. We want to encourage and promote user engagement, so that we can continually improve our statistical outputs.
We would welcome any views you have using the feedback questions below.
https://www.gov.uk/government/organisations/hm-revenue-customs/about/statistics#contact-us
We will undertake to review user comments on a quarterly basis and use this information to influence the development of our official statistics. We will summarise and publish user comments at regular intervals. As part of our user engagement, we held a consultation from 20 November 2015 to 5 February 2016. The results of this consultation have been published:
https://www.gov.uk/government/publications/user-consultation-hmrc-indirect-tax-receipts-statistics
If you have specific questions on the statistics in this publication please contact the team directly.
For further information and questions about tax rules please refer to the HMRC website.
Users
UK Property Transaction Statistics are used by government and policy makers, analysts, academics, media, businesses, public bodies and the public.
User feedback has helped shape the development and content of this publication and will continue to influence future enhancements.
Uses
These statistics are produced primarily to enable monitoring of trends in the UK residential and non-residential housing markets. Within HM Revenue and Customs and HM Treasury, they are primarily used by policy makers in the development of housing and tax policy, monitoring of tax receipts, ministerial briefing and responding to queries from the public. For example, the statistics in this publication were recently used to highlight the impact on the property market of policies such as the first time buyer relief, especially in relation to forestalling before the relief came to an end.
Outside of HMRC and HMT, past user engagement has highlighted a variety of examples for how these statistics are used:
• By market analysts and media to examine and report on the latest movements in the UK property market and the wider economy;
• Other government departments and policy makers in understanding the impact of past policy changes and to inform decisions on future policy;
• By academics and analysts to look at longer term trends in the UK property market;
• The statistics are widely used in monitoring the impact of the current economic climate on the UK property market; • Businesses tend to use the statistics to understand the property market or plan business strategies; • The country breakdowns help inform research on market movements at national levels (this is particularly relevant considering the devolution of the tax to Scotland and the current plans to devolve the tax to the Welsh Government);
They are best used in conjunction with other monthly housing market indicators, some of which can be found in the ‘Related Statistics’ section on page 7.
Code of Practice for Official Statistics
HMRC complies with the Code of Practice and supporting Principles:
https://www.gov.uk/government/organisations/hm-revenue-customs/about/statistics
https://www.gov.uk/government/organisations/hm-revenue-customs/about/statistics#cross-cutting-statistics
Pre-Release Access
Policy: https://www.gov.uk/government/uploads/system/uploads/attachment_data/file/275579/statement.pdf
Access List: https://www.gov.uk/government/statistics/hmrc-statistics-pre-release-access-list
A National Statistics Publication
National Statistics are produced to high professional standards set out in the Code of Practice for Official Statistics. They undergo regular quality assurance reviews to ensure that they meet customer needs. They are produced free from any political interference.
The United Kingdom Statistics Authority has designated these statistics as National Statistics, in accordance with the Statistics and Registration Service Act 2007 and signifying compliance with the Code of Practice for Official Statistics.
Designation can be broadly interpreted to mean that the statistics:
• meet identified user needs;
• are well explained and readily accessible;
• are produced according to sound methods, and
• are managed impartially and objectively in the public interest.
Once statistics have been designated as National Statistics it is a statutory requirement that the Code of Practice shall continue to be observed.
For general enquiries about National Statistics, contact the Customer Contact Centre on
Tel: 0845 601 3034
overseas: +44 (0)1633 817521
minicom: +44 (0)1633 815044
E-mail: info@ons.gsi.gov.uk
Fax: 01633 652747
By post: Customer Contact Centre, Office for National Statistics, Room D265, Government Buildings, Cardiff Road, Newport, NP10 8XG
You can also find National Statistics on the internet:
https://www.gov.uk/government/statistics/announcements